Get Started with Scientific Portfolio
Self-register today or contact us to see how it strengthens your investment process.
Abstract
While methodologies to measure the alignment of a financial portfolio with climate objectives develop rapidly, historical and cross-sectional analysis of greenhouse gas emissions associated with a portfolio has received little attention. Yet understanding the factors that influence these emissions is essential to identifying the levers of a portfolio manager to set ambitious but realistic reduction targets and avoid the phenomenon of “portfolio greenwashing”. This paper introduces a decomposition method inspired by those used in environmental economics which enables to disentangle five factors that influence portfolio emissions. To illustrate our model, we analyze a climate impact index and its benchmark over the period 2014-2019. We show that the index reaches a similar decarbonization rate (-35%) to its benchmark by selecting the least emissions intensive companies within the sectors and the companies that structurally reduce their emissions intensity. In contrast, the benchmark achieves this decarbonization mainly through sector allocation, the most emissive sectors being less represented.
Key takeaways:
Introduction
Investors are increasingly looking to manage the greenhouse gas emissions of their portfolios (portfolio emissions thereafter) to meet new regulatory and stakeholders’ expectations. Since the Paris Agreement (2015), many initiatives have emerged to structure these practices. On the one hand, regulators are standardizing the extra-financial information that financial and non-financial companies must communicate (e.g., in EU through the sustainable finance disclosure regulation). On the other hand, collective investor initiatives are proposing frameworks to align portfolios with climate objectives (e.g., the Net-Zero Asset Owner Alliance and the Paris Aligned Investment Initiative). While early requirements have focused on reporting, frameworks increasingly include target setting related to emissions performance metrics, including absolute and asset-level value chain emissions. However, popular climate metrics, either assessing current or forward-looking performance, give investors limited understanding and control of the factors influencing the evolution of portfolio emissions over time in the absolute or relative to other portfolios.
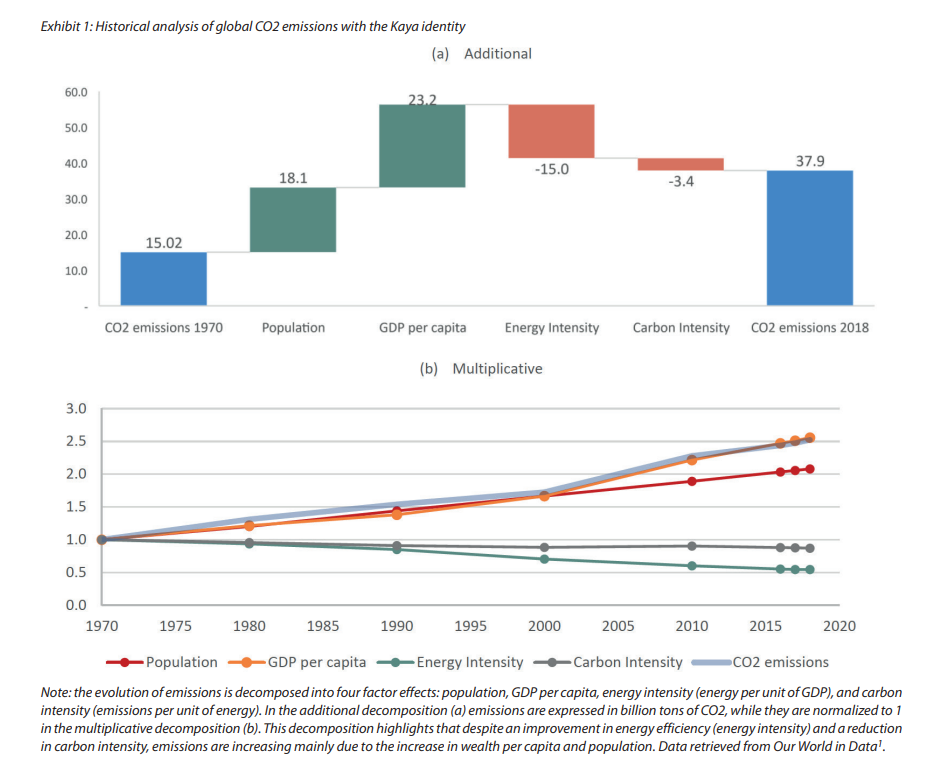
Over the last 25 years, research in environmental economics has been confronted by similar issues at the macroeconomic level and has developed decomposition methods to understand the different drivers of global emissions. One of the most famous is the “Kaya identity” (Exhibit 1), that expresses global emissions as the product of four factors: population, GDP per capita, energy intensity, and carbon intensity (Kaya, 1990).
We propose to adapt these decomposition methods to the variables of interest and factors relevant for analyzing and controlling equity portfolio emissions. The proposed decomposition model makes it possible to distinguish between five factors that influence these emissions: sector allocation (weight of a given sector in portfolio), intra-sectoral allocation (weight of a stock in the sector), emissions intensity of the firms (expressed as tons of CO2e per million dollars of sales), sales and market capitalization. The model can be applied to analyze the different performance metrics recommended by the regulator and investor initiatives (intensity, footprint, or absolute emissions), and can be used for both historical and cross-sectional analysis.
To illustrate our model, we analyze a climate impact index and its benchmark over the period 2014-2019. From a cross-sectional perspective, we show that the allocation within each sector factor explains nearly 70% of the difference between the emissions intensity of the index and its benchmark. This confirms the ability of the climate impact index to be less emissions intensive while limiting sector exposure bias. From a historical perspective, both the index and its benchmark emissions have been reduced by about 35% over the period. However, the decomposition shows that the climate impact index achieves this decarbonization mainly through intra-sectoral allocation and the selection of stocks that reduce their emissions intensity, while the benchmark achieves this decarbonization mainly through sector allocation (the most emissive sectors being less and less represented).
By revealing the factors underlying the decarbonization of a portfolio, this framework allows investors to control the extent to which emissions and emissions trends are explained by i) sector biases, which will potentially increase the portfolio’s active risk with arguably a limited effect on climate mitigation (Edmans et al., 2022), or ii) by selection of companies within sectors with lower and structurally decreasing emissions. This makes it possible to gain a more qualitative view into the decarbonization of a portfolio, and hence to limit the risk of “portfolio greenwashing” in the sense of Amenc et al. (2022).

"*" indicates required fields